U.S. COVID-19 VACCINATIONS

Updated February 17, 2022
OVERVIEW
The U.S. got a head start on the rest of the world on developing vaccines and was among the first to begin to vaccinate its population.
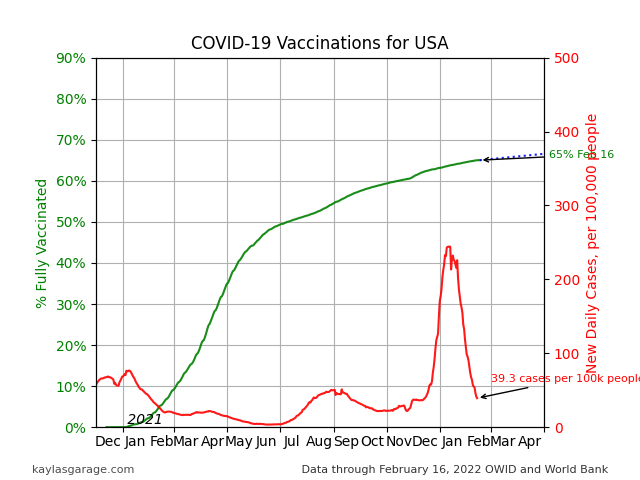
As of February 16, 2022, about 65% of the U.S. population has been fully vaccinated. Estimates indicate that at least 70% of the population would need to be vaccinated to control the virus. Some studies indicate that 80% or even 85% of the population will need vaccinations to control it.
The assumptions for vaccination rates to control the virus assume the vaccines are effective against transmitting the virus.
Some studies indicate that the delta variant can be spread by vaccinated people. If this is true then herd immunity may not be possible via vaccination. This does not mean vaccines are not important, they are critical tools to minimize hospitalization and death. Although vaccinated people may still spread the virus, they are less likely to get infected.
The chart below shows the fraction of the U.S. population that has been fully vaccinated with time (in green) along with a simple forecast (blue dotted line). The forecast is based on an average number of people who have become fully vaccinated over the week prior to the end of the data. The number of new reported daily cases per 100,000 people is in red.

If the U.S maintains its current trend, it will not achieve the minimum 70% goal that many think is needed before the end of 2021. Several things can improve the trend including increased vaccine production and more efficient vaccine distribution. It is unlikely the trend will improve.
Many things can make the trend worse including vaccine manufacturing problems, distribution issues and push-back from members of groups who fear or oppose vaccinations.
VARIATION AMONG STATES
Individual states vary in the population that has been fully vaccinated. Some states have vaccinated barely 50% of their population while others as have fully vaccinated over 70% of theirs. Initial variations were likely due to a variety of factors including allocation from the federal government, inefficiencies and inconsistencies between state health departments, population density, and more. Later variations appear be members of the population who are reluctant to step up and take the vaccine. It is becoming apparent that a lot of people are simply refusing to be vaccinated. Even worse, these people are using misinformation to convince others to refuse vaccinations. The U.S. was a leader in creating effective vaccines, but because a significant minority of its population refuses vaccinate, it will continue to have pockets of coronavirus cases.
Click on a state to see its vaccination charts.