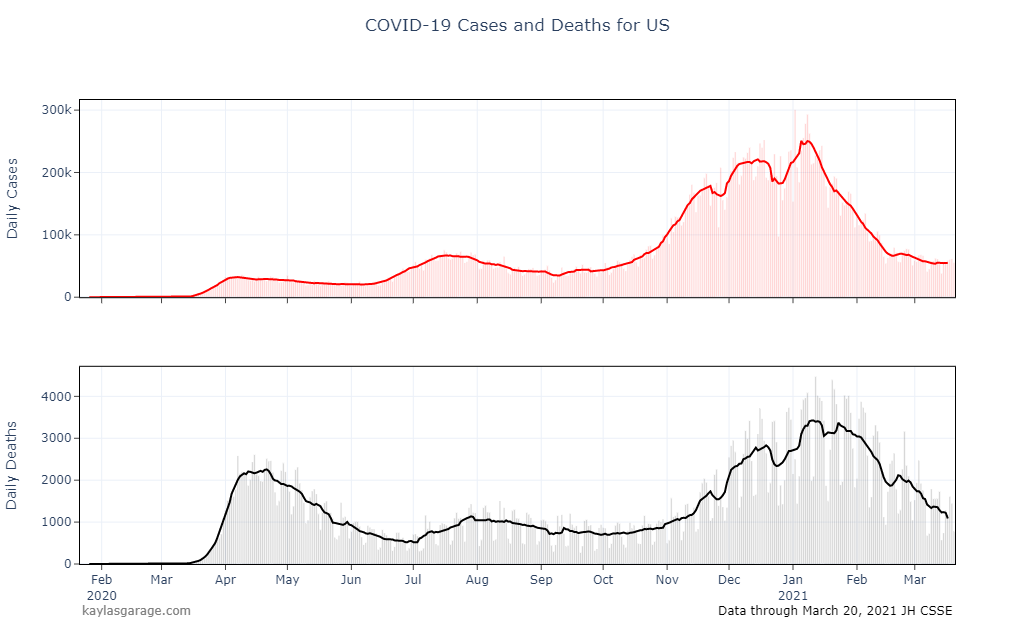
Plots of US Covid-19 Cases

We have modified the format of the plots of covid-19 cases for states in the US.
The case count pages for the U.S. as a whole now have an interactive plot that will let you select a state to see how it compares to others based on covid-19 cases and deaths per 100,000 people.
Covid-19/coronavirus charts and graphs: Covid-19 case counts for the U.S.